How To Debug The White Screen Of Death In Your Ionic App
I probably don't need to explain the dreaded White Screen Of Death, but just in case you haven't seen it yet: it's when your Ionic app is working fine in your desktop browser and then you deploy it to a device/emulator and it doesn't work! All you see is a white screen when you open the app.
In my experience, this is usually caused by missing JavaScript files. This causes the code to break while Angular is initialising the app and it ends up not being able to display the template for the first view, so the screen just displays an empty page.
Unfortunately, it's not so easy to see straight away what is causing the error, since you don't have a console on the mobile device,
I used the project from my How To Create A Different Tab Layout Per Platform In Ionic tutorial and broke something in the JavaScript code.
Let's have a look at 2 different ways to figure out what's wrong.
###Ionic Live Reload
You can use the ionic run and ionic emulate commands with the --consolelogs option to output the console messages to the terminal/command prompt window.
However, you can only use --consolelogs if you also use --livereload.
The Live Reload option is similar to when you're using ionic serve for testing your app on the desktop browser. So, when you're changing the code, the app will be instantly updated on the device.
Any changes to plugins will still require a full rebuild. For live reload to work, the dev machine and device must be on the same local network, and the device must support web sockets.
This is what the command looks like if you want to run it for iOS:
$ ionic run ios --livereload --consolelogsOr use the shorthand version:
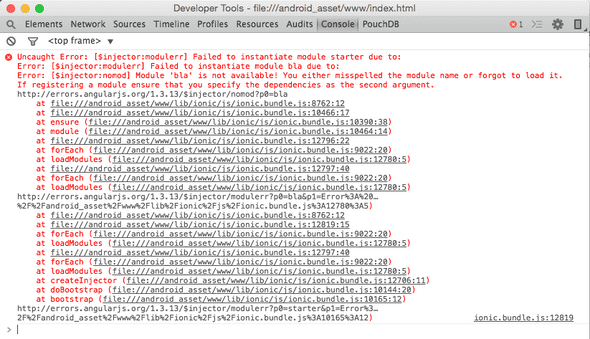
$ ionic run ios -l -cAnd now you can see the error, I am injecting a dependency called bla, that does not exist!
###Chrome Developer Tools If you're running the app on Android, you can attach the Chrome Developer Tools to the app and see the error in the Console.
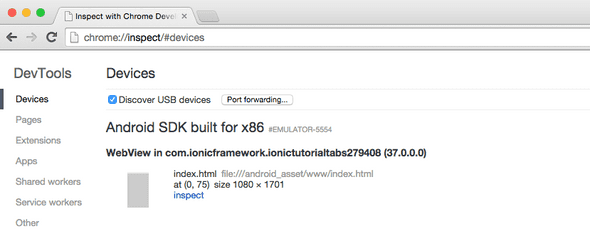
First, connect your device with a USB cable to your computer. On your desktop Chrome browser, navigate to chrome://inspect.
You should see your device listed there, if not, read this to set up your device for remote debugging. I'm using an emulator as you can see in the screenshot below.
Click on inspect and from there you can use the Developer Tools the same way you're using it for your desktop browser. If you have a look at the Console, you should see the error causing the white screen.
Unfortunately this doesn't work the same way for iOS and Safari Web Inspector. You can attach Web Inspector to the app, but it will not display any errors that occurred before you connected it.
As you can see, the easiest way is to use the Live Reload option, which will work for both iOS and Android. And if for some reason you don't want to use that, you can use the Chrome Developer Tools.
####Read More Testing Mobile: Emulators, Simulators And Remote Debugging


