How To Log Errors In Your Ionic 2+ App With Sentry
Sentry is an open source solution for tracking errors in applications. You can install Sentry on your own server and let your app send its errors there or you can use the Sentry hosted service, starting with a free plan that tracks up to 10.000 events per month.
In this tutorial, we'll build an Ionic 2 app that logs its errors to the hosted Sentry service.
Create Ionic app
We'll start with a simple Ionic 2 app that has a button on it and when you click it, an error will be thrown.
$ ionic start ionic2-tutorial-sentry blank --v2In src/pages/home/home.html add the button:
<ion-header>
  <ion-navbar>
    <ion-title>
      Sentry Tutorial
    </ion-title>
  </ion-navbar>
</ion-header>

<ion-content padding>
  <button ion-button (click)="doSomething()">Throw Error</button>
</ion-content>
In src/pages/home/home.ts add the click handler for the button:
import { Component } from "@angular/core";
import { NavController } from "ionic-angular";

@Component({
  selector: "page-home",
  templateUrl: "home.html"
})
export class HomePage {
  constructor(public navCtrl: NavController) {}

  doSomething() {
    throw new Error("I am a bug... 🐛");
  }
}
Let's fire up the app and confirm that we get the error when clicking the button.
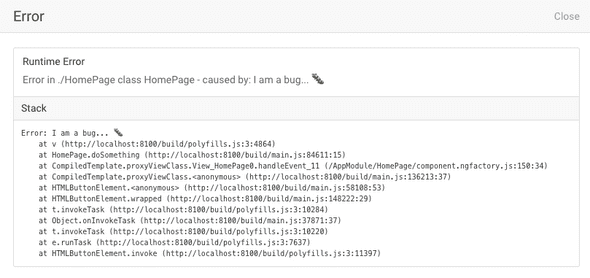
$ ionic serveYou should see an error screen pop up that shows you the error and the call stack. This is handled by IonicErrorHandler which catches all exceptions and displays them (only during development).
We'll create our own custom ErrorHandler to also log these errors to Sentry.
Set up Sentry account
Sign up for a free Sentry account and create a new project. I've named mine the same as the app: ionic2-tutorial-sentry.
Click on the Get Your DSN link and copy your Public DSN (Data Source Name). We'll use this in the app when we send the error to Sentry.
Install Raven.js
Sentry comes with a JavaScript library called Raven.js which we can use to send errors to the Sentry server.
Install the library with npm:
$ npm install raven-js --saveCreate Custom ErrorHandler
Next, we'll create a custom ErrorHandler to catch all errors in the application and send them to Sentry.
Create the folder src\services and add a new file sentry-errorhandler.ts. Our custom ErrorHandler will extend IonicErrorHandler so we will still get the error view during development.
import { IonicErrorHandler } from "ionic-angular";
import Raven from "raven-js";

Raven.config("<YOUR DSN>").install();

export class SentryErrorHandler extends IonicErrorHandler {
  handleError(error) {
    super.handleError(error);

    try {
      Raven.captureException(error.originalError || error);
    } catch (e) {
      console.error(e);
    }
  }
}
Now all we need to do is modify app.module.ts and replace IonicErrorHandler with SentryErrorHandler in the providers section. Don't forget to import SentryErrorHandler.
providers: [{ provide: ErrorHandler, useClass: SentryErrorHandler }];Test Logging
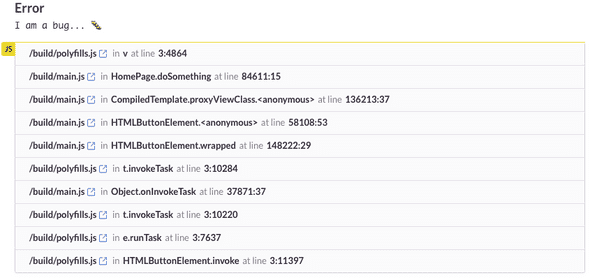
Test the app again and you should still see the Ionic Error screen pop up. Go back into your Sentry account and you should now see the error logged as an issue there.
As you can see the error is being logged with references to the main.js bundle but that information is not very helpful since it's all minified code. It would be much more helpful if you could see where exactly the error occurs in our TypeScript code, just like when you're debugging it in Chrome Dev Tools.
The Ionic build scripts generate a source map for us in main.js.map and we can upload it to Sentry so it can map the minified code to the TypeScript code.
Add Source Maps
Ionic bundles the JavaScript code in the www/build/ directory.
We'll use the Sentry CLI to upload the files from this directory to the Sentry server. This CLI is only available for OS X and Linux, but you can also use the Sentry API if you're on another OS.
Install the Sentry CLI:
$ curl -sL https://sentry.io/get-cli/ | bashUse the login helper to generate an API token which will be used by the CLI:
$ sentry-cli loginThis will open a browser, just follow the instructions on the screen until you have your token, then go back to the CLI and paste it in there. The token will be saved in the file .sentryclirc and will be used from now on by the CLI to connect to your Sentry account.
Before we can upload the files we have to create a release to connect them to. Let's say that this is release 1.0.0 for this app. You'll also need to provide the organization name and project name you've set up on Sentry.
$ sentry-cli releases -o ORG_NAME -p PROJECT_NAME new 1.0.0And now we can upload the files, run this command from the root directory of your Ionic application:
$ sentry-cli releases -o ORG_NAME -p PROJECT_NAME files 1.0.0 upload-sourcemaps --url-prefix / www/buildSentry matches the file paths in the stack trace of the error to the uploaded files, so you need to specify a --url-prefix for your files to make them match the file paths. However, these URLs are different for Ionic apps when you run them in the browser, in a simulator, and on a device.
We don't always know exactly what the URL will be, so we'll just set the --url-prefix to / and make sure that the stack trace sent to Sentry will always reference the files as e.g. /main.js instead of something like this file:///var/containers/Bundle/Application/917CE560-A694-4813-B298-8E7FAE0ED6D9/ionic2-tutorial-sentry.app/www/build/main.js.
The last thing we have to do now is to make sure our app is logging the errors under the correct release number and that the file names in the stack trace match the uploaded files.
So go back into the code of your SentryErrorHandler and add the release number to the Raven.config call. The dataCallback function will get rid of the paths in the filenames so we end up with just the file name. Sentry will then be able to map these to the uploaded files.
Raven.config("YOUR DSN", {
  release: "1.0.0",
  dataCallback: data => {
    if (data.culprit) {
      data.culprit = data.culprit.substring(data.culprit.lastIndexOf("/"));
    }

    var stacktrace =
      data.stacktrace ||
      (data.exception && data.exception.values[0].stacktrace);

    if (stacktrace) {
      stacktrace.frames.forEach(function(frame) {
        frame.filename = frame.filename.substring(
          frame.filename.lastIndexOf("/")
        );
      });
    }
  }
}).install();
Test Logging with Source Maps
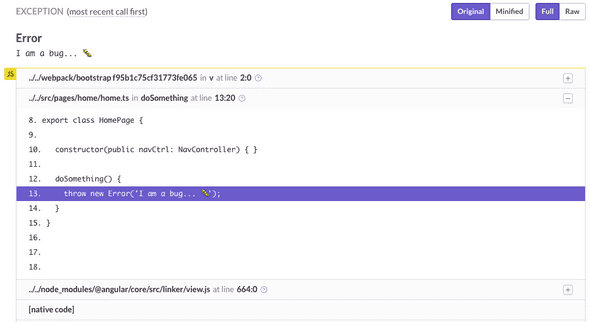
Test the app again, you should now see the error pop up in the Sentry dashboard with the code for home.ts and the line that throws the error should be highlighted.
Testing on mobile devices
I've only tested the logging on an iOS device so if you're having any issues or can confirm that it works on other devices let me know in the comments.
When to update the source maps
In this tutorial I've used Sentry with the source maps during development because it was easier to demonstrate how that works. You obviously don't need to log to Sentry during development because you can just open up your Dev Tools and see the error and debug it.
When you're building a real app you'll probably only want to log errors to Sentry when you do test or production releases.
So, any time you do a test/production release you'll need to update your source maps on Sentry with the latest build, because your code will have changed and will no longer match the source map from the previous release.
You'll also need to make a change in the Raven.config call to make sure your errors are logged under the new release number.


